Datasets
Central to Spinque Desk are knowledge graphs. They allow data from different sources and types to be linked together into one rich model of a domain. We call the process of creating a knowledge graph from separate data sources ‘data virtualization’. It consists of a number of steps that you can perform in the Datasets section of Spinque Desk.
Adding Data Sources
The first step in data virtualization is defining where your source data is located and how it can be read. You do this by creating a dataset and filling it with one or more data sources. Data sources can be XLSX, JSON, XML, CSV or RDF files, as well as connections to SQL databases or remote APIs, and many others.
Data sources are configured automatically. If the default settings do not apply to your data source you can adjust them manually. See the settings for different data types:
Spinque Desk converts all data sources into virtual XML fragments. For example, given a CSV file actors.csv:
actorID,actorName
1,John Travolta
2,Uma Thurman
Spinque Desk produces the following two XML fragments:
<row>
  <field column="0" name="actorID">1</field>
  <field column="1" name="actorName">John Travolta</field>
</row>
<row>
  <field column="0" name="actorID">2</field>
  <field column="1" name="actorName">Uma Thurman</field>
</row>
The virtual XML unifies the syntax for the next step in the data virtualization process, mapping the data to a knowledge graph. The virtual XML can be more verbose than the source data. This doesn’t really matter as the fragment only exists virtually. It will never be written to disk during the indexing process.
Defining Data Mappings
The second step in data virtualization is the mapping of the virtual XML fragments to the knowledge graph. This is visualised in the image below:
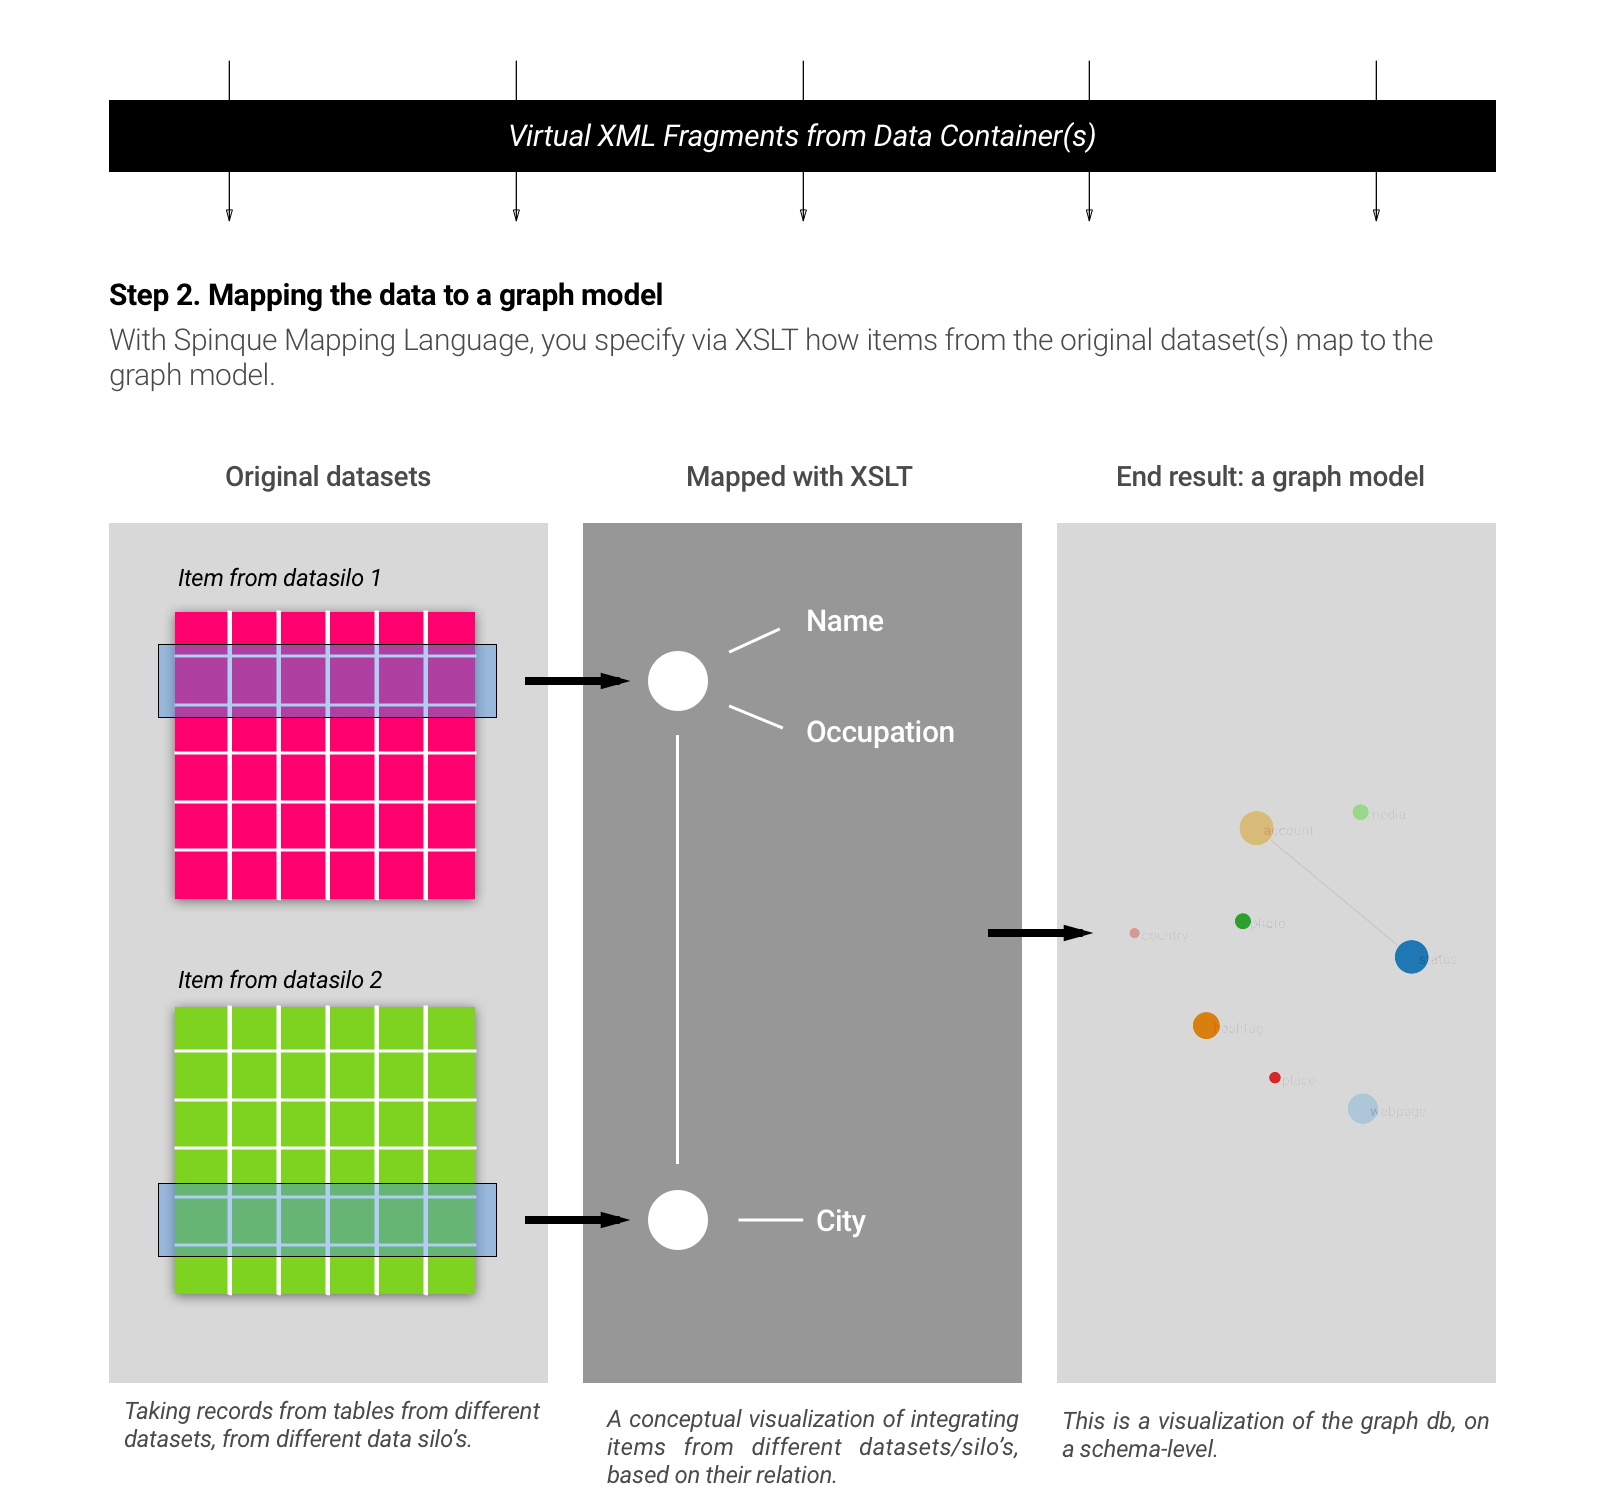
Data Mapping
For each data source we define a mapping in the Spinque Mapping Language. The mapping language is an extension of XSLT, a transformation language for XML. As in any XSLT you define templates that match with elements in your XML data. In this case the virtual XML that comes out of a data source. The key differences between a normal XSLT file and a Spinque data mapping is that we do not write the normal textual output of the XSLT, but instead generate triples.
We assume that you have basic knowledge of writing XSLT. You do not need to know how to execute XSLT. Spinque takes care of the whole pipeline for you. The documentation of the mapping language explains in detail how to create a mapping:
By including the su (Spinque Utilities) namespace in your data mapping you get access to some additional utility functions. Examples are methods to transform strings, such as changing the case, splitting, and normalizing. There are also methods for processing numbers, dates and person names:
You have to decide yourself which attributes, relations and types (classes) you want to model and how you want to name them. This does not mean that you have to invent all of them yourself. There are many vocabularies available. The Open Knowledge Foundation provides an extensive overview of vocabularies.
We advise to reuse existing vocabularies whenever available. When your domain requires a more specific vocabulary you can extend existing vocabularies. But in some cases it also makes sense to invent your own vocabulary.
Loading your Graph
The third and final step in data virtualization is storing the triples that are generated by your data mapping(s) in Spinque’s graph database. In this step the data mappings that you wrote are applied to all the data in your data sources. We often refer to this step as indexing or loading.
With the completion of this step the data virtualization process is finished. You’ll now be able to inspect the result; to take a look at the objects, attributes and relations that make up your knowledge graph. Further you can share it with specific or all workspaces and finally you can use it in search strategies.
Publishing Open Data
If you want to publish your datasets to the public, then this is possible via Spinque Desk. After your graph has been loaded, your data can be shared via the Share tab on the dataset overview page. In order to share the dataset to the public, you need to select the “All workspaces” option, and then checkmark the box to share the data via data.spinque.com. Optionally, you can set a dataset description in the Metadata section, and choose a License under which you want to publish your dataset. Then, the next time the graph is built, your data will automatically be published via our Linked Data server, and you can find the data at: https://data.spinque.co/ld/data/{YOUR_WORKSPACE_NAME}.
By default, the data will be published as a RDF N-triple file, which contains all relations of your knowledge graph. It is possible to directly ingest these files into Spinque. It’s also possible to publish your text data via the Common Index File Format (CIFF). For a CIFF index it is necessary to choose how your text data should be pre-processed to tokens. Additionally, a selection of which text attributes that need to be exported needs to be provided.